
Sirolimus
These highlights do not include all the information needed to use SIROLIMUS ORAL SOLUTION safely and effectively. See full prescribing information for SIROLIMUS ORAL SOLUTION. SIROLIMUS oral solution Initial U.S. Approval: 1999
9f64692d-2a18-ffcb-c572-0f218a71ca67
HUMAN PRESCRIPTION DRUG LABEL
Sep 22, 2025
Apotex Corp
DUNS: 845263701
Products 1
Detailed information about drug products covered under this FDA approval, including NDC codes, dosage forms, ingredients, and administration routes.
SIROLIMUS
Product Details
FDA regulatory identification and product classification information
FDA Identifiers
Product Classification
Product Specifications
INGREDIENTS (9)
Drug Labeling Information
PACKAGE LABEL.PRINCIPAL DISPLAY PANEL
PRINCIPAL DISPLAY PANEL - 1 mg/mL Oral Solution Bottle Label
BOTTLE****LABEL - PRINCIPAL DISPLAY PANEL
Representative sample of labeling (see HOW SUPPLIED section of complete listing):
APOTEX CORP.
NDC 60505-6197-2
Sirolimus Oral Solution
1 mg/mL
Rx only
CLINICAL STUDIES SECTION
14 CLINICAL STUDIES
14.1 Prophylaxis of Organ Rejection in Renal Transplant Patients
Sirolimus Oral Solution
The safety and efficacy of sirolimus oral solution for the prevention of organ rejection following renal transplantation were assessed in two randomized, double-blind, multicenter, controlled trials. These studies compared two dose levels of sirolimus oral solution (2 mg and 5 mg, once daily) with azathioprine (Study 1) or placebo (Study 2) when administered in combination with cyclosporine and corticosteroids. Study 1 was conducted in the United States at 38 sites. Seven hundred nineteen (719) patients were enrolled in this trial and randomized following transplantation; 284 were randomized to receive sirolimus oral solution 2 mg/day; 274 were randomized to receive sirolimus oral solution 5 mg/day, and 161 to receive azathioprine 2 to 3 mg/kg/day. Study 2 was conducted in Australia, Canada, Europe, and the United States, at a total of 34 sites. Five hundred seventy-six (576) patients were enrolled in this trial and randomized before transplantation; 227 were randomized to receive sirolimus oral solution 2 mg/day; 219 were randomized to receive sirolimus oral solution 5 mg/day, and 130 to receive placebo. In both studies, the use of antilymphocyte antibody induction therapy was prohibited. In both studies, the primary efficacy endpoint was the rate of efficacy failure in the first 6 months after transplantation. Efficacy failure was defined as the first occurrence of an acute rejection episode (confirmed by biopsy), graft loss, or death.
The tables below summarize the results of the primary efficacy analyses from these trials. Sirolimus oral solution, at doses of 2 mg/day and 5 mg/day, significantly reduced the incidence of efficacy failure (statistically significant at the < 0.025 level; nominal significance level adjusted for multiple [2] dose comparisons) at 6 months following transplantation compared with both azathioprine and placebo.
TABLE 8: INCIDENCE (%) OF EFFICACY FAILURE AT 6 AND 24 MONTHS FOR STUDY 1****a,b
|
****Parameter |
Sirolimus Oral Solution 2 mg/day |
Sirolimus Oral Solution 5 mg/day |
Azathioprine 2-3 mg/kg/day |
|
Efficacy failure at 6 monthsc |
18.7 |
16.8 |
32.3 |
|
Components of efficacy failure | |||
|
Biopsy-proven acute rejection |
16.5 |
11.3 |
29.2 |
|
Graft loss |
1.1 |
2.9 |
2.5 |
|
Death |
0.7 |
1.8 |
0 |
|
Lost to follow-up |
0.4 |
0.7 |
0.6 |
|
Efficacy failure at 24 months |
32.8 |
25.9 |
36 |
|
Components of efficacy failure | |||
|
Biopsy-proven acute rejection |
23.6 |
17.5 |
32.3 |
|
Graft loss |
3.9 |
4.7 |
3.1 |
|
Death |
4.2 |
3.3 |
0 |
|
Lost to follow-up |
1.1 |
0.4 |
0.6 |
a: Patients received cyclosporine and corticosteroids.
b: Includes patients who prematurely discontinued treatment.
c: Primary endpoint.
TABLE 9: INCIDENCE (%) OF EFFICACY FAILURE AT 6 AND 36 MONTHS FOR STUDY 2****a,b
|
Sirolimus Oral Solution 2 mg/day |
Sirolimus Oral Solution 5 mg/day |
Placebo (n = 130) | |
|
Parameter |
(n = 227) |
(n = 219) | |
|
Efficacy failure at 6 monthsc |
30 |
25.6 |
47.7 |
|
Components of efficacy failure | |||
|
Biopsy-proven acute rejection |
24.7 |
19.2 |
41.5 |
|
Graft loss |
3.1 |
3.7 |
3.9 |
|
Death |
2.2 |
2.7 |
2.3 |
|
Lost to follow-up |
0 |
0 |
0 |
|
Efficacy failure at 36 months |
44.1 |
41.6 |
54.6 |
|
Components of efficacy failure | |||
|
Biopsy-proven acute rejection |
32.2 |
27.4 |
43.9 |
|
Graft loss |
6.2 |
7.3 |
4.6 |
|
Death |
5.7 |
5.9 |
5.4 |
|
Lost to follow-up |
0 |
0.9 |
0.8 |
a: Patients received cyclosporine and corticosteroids.
b: Includes patients who prematurely discontinued treatment.
c: Primary endpoint.
Patient and graft survival at 1 year were co-primary endpoints. The following table shows graft and patient survival at 1 and 2 years in Study 1, and 1 and 3 years in Study 2. The graft and patient survival rates were similar in patients treated with sirolimus and comparator-treated patients.
**TABLE 10: GRAFT AND PATIENT SURVIVAL (%) FOR STUDY 1 (12 AND 24 MONTHS) AND STUDY 2 (12 AND 36 MONTHS)**a,b
|
********Parameter |
Sirolimus Oral Solution 2 mg/day |
Sirolimus Oral Solution 5 mg/day |
Azathioprine 2-3 mg/kg/day |
Placebo |
|
Study 1 |
(n = 284) |
(n = 274) |
(n = 161) | |
|
Graft survival | ||||
|
Month 12 |
94.7 |
92.7 |
93.8 | |
|
Month 24 |
85.2 |
89.1 |
90.1 | |
|
Patient survival | ||||
|
Month 12 |
97.2 |
96.0 |
98.1 | |
|
Month 24 |
92.6 |
94.9 |
96.3 | |
|
Study 2 |
(n = 227) |
(n = 219) |
(n = 130) | |
|
Graft survival | ||||
|
Month 12 |
89.9 |
90.9 |
87.7 | |
|
Month 36 |
81.1 |
79.9 |
80.8 | |
|
Patient survival | ||||
|
Month 12 |
96.5 |
95.0 |
94.6 | |
|
Month 36 |
90.3 |
89.5 |
90.8 |
a: Patients received cyclosporine and corticosteroids.
b: Includes patients who prematurely discontinued treatment.
The reduction in the incidence of first biopsy-confirmed acute rejection episodes in patients treated with sirolimus compared with the control groups included a reduction in all grades of rejection.
In Study 1, which was prospectively stratified by race within center, efficacy failure was similar for sirolimus oral solution 2 mg/day and lower for sirolimus oral solution 5 mg/day compared with azathioprine in Black patients. In Study 2, which was not prospectively stratified by race, efficacy failure was similar for both sirolimus oral solution doses compared with placebo in Black patients. The decision to use the higher dose of sirolimus oral solution in Black patients must be weighed against the increased risk of dose-dependent adverse events that were observed with the sirolimus oral solution 5-mg dose [see Adverse Reactions (6.1)].
TABLE 11: PERCENTAGE OF EFFICACY FAILURE BY RACE AT 6 MONTHS****a,b
|
Parameter |
Sirolimus Oral Solution 2 mg/day |
Sirolimus Oral Solution 5 mg/day |
Azathioprine 2-3 mg/kg/day |
Placebo |
|
Study 1 |
34.9 (n = 63) |
18 (n = 61) |
33.3 (n = 42) | |
|
Study 2 |
30.8 (n = 26) |
33.7 (n = 27) |
38.5 (n = 13) |
a: Patients received cyclosporine and corticosteroids.
b: Includes patients who prematurely discontinued treatment.
Mean glomerular filtration rates (GFR) post-transplant were calculated by using the Nankivell equation at 12 and 24 months for Study 1, and 12 and 36 months for Study 2. Mean GFR was lower in patients treated with cyclosporine and sirolimus oral solution compared with those treated with cyclosporine and the respective azathioprine or placebo control.
TABLE 12: OVERALL CALCULATED GLOMERULAR FILTRATION RATES (Mean ± SEM, cc/min) BY NANKIVELL EQUATION POST-TRANSPLANT****a,b
|
Parameter |
Sirolimus Oral Solution 2 mg/day |
Sirolimus Oral Solution 5 mg/day |
Azathioprine 2-3 mg/kg/day |
Placebo |
|
Study 1 | ||||
|
Month 12 |
57.4 ± 1.3 |
54.6 ± 1.3 |
64.1 ± 1.6) | |
|
Month 24 |
58.4 ± 1.5 |
52.6 ± 1.5 |
62.4 ± 1.9 | |
|
Study 2 | ||||
|
Month 12 |
52.4 ± 1.5 |
51.5 ± 1.5 |
58 ± 2.1 | |
|
Month 36 |
48.1 ± 1.8 |
46.1 ± 2 |
53.4 ± 2.7 |
a: Includes patients who prematurely discontinued treatment.
b: Patients who had a graft loss were included in the analysis with GFR set to 0.
Within each treatment group in Studies 1 and 2, mean GFR at one-year post- transplant was lower in patients who experienced at least one episode of biopsy-proven acute rejection, compared with those who did not.
Renal function should be monitored, and appropriate adjustment of the immunosuppressive regimen should be considered in patients with elevated or increasing serum creatinine levels [see Warnings and Precautions (5.8)].
14.2 Cyclosporine Withdrawal Study in Renal Transplant Patients
The safety and efficacy of sirolimus as a maintenance regimen were assessed following cyclosporine withdrawal at 3 to 4 months after renal transplantation. Study 3 was a randomized, multicenter, controlled trial conducted at 57 centers in Australia, Canada, and Europe. Five hundred twenty- five (525) patients were enrolled. All patients in this study received the tablet formulation. This study compared patients who were administered sirolimus, cyclosporine, and corticosteroids continuously with patients who received this same standardized therapy for the first 3 months after transplantation (pre-randomization period) followed by the withdrawal of cyclosporine. During cyclosporine withdrawal, the sirolimus dosages were adjusted to achieve targeted sirolimus whole blood trough concentration ranges (16 to 24 ng/mL until month 12, then 12 to 20 ng/mL thereafter, expressed as chromatographic assay values). At 3 months, 430 patients were equally randomized to either continue sirolimus with cyclosporine therapy or to receive sirolimus as a maintenance regimen following cyclosporine withdrawal.
Eligibility for randomization included no Banff Grade 3 acute rejection or vascular rejection episode in the 4 weeks before random assignment, serum creatinine ≤ 4.5 mg/dL, and adequate renal function to support cyclosporine withdrawal (in the opinion of the investigator). The primary efficacy endpoint was graft survival at 12 months after transplantation. Secondary efficacy endpoints were the rate of biopsy-confirmed acute rejection, patient survival, incidence of efficacy failure (defined as the first occurrence of either biopsy-proven acute rejection, graft loss, or death), and treatment failure (defined as the first occurrence of either discontinuation, acute rejection, graft loss, or death).
The following table summarizes the resulting graft and patient survival at 12, 24, and 36 months for this trial. At 12, 24, and 36 months, graft and patient survival were similar for both groups.
TABLE 13: GRAFT AND PATIENT SURVIVAL (%): STUDY 3****a
|
Sirolimus with Cyclosporine Therapy |
Sirolimus Following Cyclosporine Withdrawal | |
|
Parameter |
(n = 215) |
(n = 215) |
|
Graft Survival Month 12b |
****95.3c |
****97.2 |
|
Month 24 |
91.6 |
94 |
|
Month 36d |
87 |
91.6 |
|
Patient Survival | ||
|
Month 12 |
97.2 |
98.1 |
|
Month 24 |
94.4 |
95.8 |
|
Month 36d |
91.6 |
94.0 |
a: Includes patients who prematurely discontinued treatment.
b: Primary efficacy endpoint.
c: Survival including loss to follow-up as an event.
d: Initial planned duration of the study.
The following table summarizes the results of first biopsy-proven acute rejection at 12 and 36 months. There was a significant difference in first biopsy-proven rejection rates between the two groups after randomization and through 12 months. Most of the post-randomization acute rejections occurred in the first 3 months following randomization.
TABLE 14: INCIDENCE OF FIRST BIOPSY-PROVEN ACUTE REJECTION (%) BY TREATMENT GROUP AT 36 MONTHS: STUDY 3****a,b
|
Period |
Sirolimus with Cyclosporine Therapy (n = 215) |
Sirolimus Following Cyclosporine Withdrawal (n = 215) |
|
Pre-randomizationc |
9.3 |
10.2 |
|
Post-randomization through 12 monthsc |
4.2 |
9.8 |
|
Post-randomization from 12 to 36 months |
1.4 |
0.5 |
|
Post-randomization through 36 months |
5.6 |
10.2 |
|
Total at 36 months |
14.9 |
20.5 |
a: Includes patients who prematurely discontinued treatment.
b: All patients received corticosteroids.
c: Randomization occurred at 3 months ± 2 weeks.
Patients receiving renal allografts with ≥ 4 HLA mismatches experienced significantly higher rates of acute rejection following randomization to the cyclosporine withdrawal group, compared with patients who continued cyclosporine (15.3% versus 3%). Patients receiving renal allografts with ≤ 3 HLA mismatches demonstrated similar rates of acute rejection between treatment groups (6.8% versus 7.7%) following randomization.
The following table summarizes the mean calculated GFR in Study 3 (cyclosporine withdrawal study).
TABLE 15: CALCULATED GLOMERULAR FILTRATION RATES (mL/min) BY NANKIVELL EQUATION AT 12, 24, AND 36 MONTHS POST-TRANSPLANT: STUDY 3****a,b,c
|
****Parameter |
Sirolimus with Cyclosporine Therapy |
Sirolimus Following Cyclosporine Withdrawal |
|
Month 12 | ||
|
Mean ± SEM |
53.2 ± 1.5 |
59.3 ± 1.5 |
|
Month 24 | ||
|
Mean ± SEM |
48.4 ± 1.7 |
58.4 ± 1.6 |
|
Month 36 | ||
|
Mean ± SEM |
47 ± 1.8 |
58.5 ± 1.9 |
a: Includes patients who prematurely discontinued treatment.
b: Patients who had a graft loss were included in the analysis and had their GFR set to 0.
c: All patients received corticosteroids.
The mean GFR at 12, 24, and 36 months, calculated by the Nankivell equation, was significantly higher for patients receiving sirolimus as a maintenance regimen following cyclosporine withdrawal than for those in the sirolimus with cyclosporine therapy group. Patients who had an acute rejection prior to randomization had a significantly higher GFR following cyclosporine withdrawal compared to those in the sirolimus with cyclosporine group. There was no significant difference in GFR between groups for patients who experienced acute rejection post-randomization.
Although the initial protocol was designed for 36 months, there was a subsequent amendment to extend this study. The results for the cyclosporine withdrawal group at months 48 and 60 were consistent with the results at month 36. Fifty-two percent (112/215) of the patients in the sirolimus with cyclosporine withdrawal group remained on therapy to month 60 and showed sustained GFR.
14.3 High-Immunologic Risk Renal Transplant Patients
Sirolimus was studied in a one-year, clinical trial in high risk patients (Study 4) who were defined as Black transplant recipients and/or repeat renal transplant recipients who lost a previous allograft for immunologic reasons and/or patients with high panel-reactive antibodies (PRA; peak PRA level > 80%). Patients received concentration-controlled sirolimus and cyclosporine (MODIFIED), and corticosteroids per local practice. The sirolimus dose was adjusted to achieve target whole blood trough sirolimus concentrations of 10 to 15 ng/mL (chromatographic method) throughout the 12-month study period. The cyclosporine dose was adjusted to achieve target whole blood trough concentrations of 200 to 300 ng/mL through week 2, 150 to 200 ng/mL from week 2 to week 26, and 100 to 150 ng/mL from week 26 to week 52 [see Clinical Pharmacology (12.3)] for the observed trough concentrations ranges. Antibody induction was allowed per protocol as prospectively defined at each transplant center, and was used in 88.4% of patients. The study was conducted at 35 centers in the United States. A total of 224 patients received a transplant and at least one dose of sirolimus and cyclosporine and was comprised of 77.2% Black patients, 24.1% repeat renal transplant recipients, and 13.5% patients with high PRA. Efficacy was assessed with the following endpoints, measured at 12 months: efficacy failure (defined as the first occurrence of biopsy- confirmed acute rejection, graft loss, or death), first occurrence of graft loss or death, and renal function as measured by the calculated GFR using the Nankivell formula. The table below summarizes the result of these endpoints.
TABLE 16: EFFICACY FAILURE, GRAFT LOSS OR DEATH AND CALCULATED GLOMERULAR FUNCTION RATES (mL/min) BY NANKIVELL EQUATION AT 12 MONTHS POST-TRANSPLANT: STUDY 4
|
Parameter |
Sirolimus with Cyclosporine, Corticosteroids (n = 224) |
|
Efficacy Failure (%) |
23.2 |
|
Graft Loss or Death (%) |
9.8 |
|
Renal Function (mean ± SEM)a,b |
52.6 ± 1.6 (n = 222) |
a: Calculated glomerular filtration rate by Nankivell equation.
b: Patients who had graft loss were included in this analysis with GFR set to 0.
Patient survival at 12 months was 94.6%. The incidence of biopsy-confirmed acute rejection was 17.4% and the majority of the episodes of acute rejection were mild in severity.
14.4 Conversion from Calcineurin Inhibitors to Sirolimus Oral Solution in
Maintenance Renal Transplant Patients
Conversion from calcineurin inhibitors (CNI) to sirolimus was assessed in maintenance renal transplant patients 6 months to 10 years post-transplant (Study 5). This study was a randomized, multicenter, controlled trial conducted at 111 centers globally, including US and Europe, and was intended to show that renal function was improved by conversion from CNI to sirolimus. Eight hundred thirty (830) patients were enrolled and stratified by baseline calculated glomerular filtration rate (GFR, 20 to 40 mL/min versus greater than 40 mL/min). In this trial there was no benefit associated with conversion with regard to improvement in renal function and a greater incidence of proteinuria in the sirolimus conversion arm. In addition, enrollment of patients with baseline calculated GFR less than 40 mL/min was discontinued due to a higher rate of serious adverse events, including pneumonia, acute rejection, graft loss and death [see Adverse Reactions (6.4)].
This study compared renal transplant patients (6 to 120 months after transplantation) who were converted from calcineurin inhibitors to sirolimus, with patients who continued to receive calcineurin inhibitors. Concomitant immunosuppressive medications included mycophenolate mofetil (MMF), azathioprine (AZA), and corticosteroids. Sirolimus was initiated with a single loading dose of 12 to 20 mg, after which dosing was adjusted to achieve a target sirolimus whole blood trough concentration of 8 to 20 ng/mL (chromatographic method). The efficacy endpoint was calculated GFR at 12 months post-randomization. Additional endpoints included biopsy-confirmed acute rejection, graft loss, and death. Findings in the patient stratum with baseline calculated GFR greater than 40 mL/min (sirolimus conversion, n = 497; CNI continuation, n = 246) are summarized below. There was no clinically or statistically significant improvement in Nankivell GFR compared to baseline.
TABLE 17: RENAL FUNCTION IN STABLE RENAL TRANSPLANT PATIENTS IN PATIENTS WITH BASELINE GFR > 40 mL/min THE SIROLIMUS CONVERSION STUDY (STUDY 5)
|
Parameter |
Sirolimus conversion N = 496 |
CNI continuation N = 245 |
Difference (95% CI) |
|
GFR mL/min (Nankivell) at 1 year |
59 |
57.7 |
1.3 (-1.1, 3.7) |
|
GFR mL/min (Nankivell) at 2 year |
53.7 |
52.1 |
1.6 (-1.4, 4.6) |
The rates of acute rejection, graft loss, and death were similar at 1 and 2 years. Treatment-emergent adverse events occurred more frequently during the first 6 months after sirolimus conversion. The rates of pneumonia were significantly higher for the sirolimus conversion group.
While the mean and median values for urinary protein to creatinine ratio were similar between treatment groups at baseline, significantly higher mean and median levels of urinary protein excretion were seen in the sirolimus conversion arm at 1 year and at 2 years, as shown in the table below [see Warnings and Precautions (5.9)]. In addition, when compared to patients who continued to receive calcineurin inhibitors, a higher percentage of patients had urinary protein to creatinine ratios > 1 at 1 and 2 years after sirolimus conversion. This difference was seen in both patients who had a urinary protein to creatinine ratio ≤ 1 and those who had a protein to creatinine ratio > 1 at baseline. More patients in the sirolimus conversion group developed nephrotic range proteinuria, as defined by a urinary protein to creatinine ratio > 3.5 (46/482 [9.5%] versus 9/239 [3.8%]), even when the patients with baseline nephrotic range proteinuria were excluded. The rate of nephrotic range proteinuria was significantly higher in the sirolimus conversion group compared to the calcineurin inhibitor continuation group with baseline urinary protein to creatinine ratio > 1 (13/29 versus 1/14), excluding patients with baseline nephrotic range proteinuria.
TABLE 18: MEAN AND MEDIAN VALUES FOR URINARY PROTEIN TO CREATININE RATIO (mg/mg) BETWEEN TREATMENT GROUPS AT BASELINE, 1 AND 2 YEARS IN THE STRATUM WITH BASELINE CALCULATED GFR > 40 mL/min
|
Study period |
Sirolimus Conversion |
CNI Continuation | |||||
|
N |
Mean ± SD |
Median |
N |
Mean ± SD |
Median |
p-value | |
|
Baseline |
410 |
0.35 ± 0.76 |
0.13 |
207 |
0.28 ± 0.61 |
0.11 |
0.381 |
|
1 year |
423 |
0.88 ± 1.61 |
0.31 |
203 |
0.37 ± 0.88 |
0.14 |
<0.001 |
|
2 years |
373 |
0.86 ± 1.48 |
0.32 |
190 |
0.47 ± 0.98 |
0.13 |
<0.001 |
The above information should be taken into account when considering conversion from calcineurin inhibitors to sirolimus in stable renal transplant patients due to the lack of evidence showing that renal function improves following conversion, and the finding of a greater increment in urinary protein excretion, and an increased incidence of treatment-emergent nephrotic range proteinuria following conversion to sirolimus. This was particularly true among patients with existing abnormal urinary protein excretion prior to conversion.
In an open-label, randomized, comparative, multicenter study where kidney transplant patients were either converted from tacrolimus to sirolimus 3 to 5 months post-transplant (sirolimus group) or remained on tacrolimus, there was no significant difference in renal function at 2 years post-transplant. Overall, 44/131 (33.6%) discontinued treatment in the sirolimus group versus 12/123 (9.8%) in the tacrolimus group. More patients reported adverse events 130/131 (99.2%) versus 112/123 (91.1%) and more patients reported discontinuations from the treatment due to adverse events 28/131 (21.4%) versus 4/123 (3.3%) in the sirolimus group compared to the tacrolimus group.
The incidence of biopsy-confirmed acute rejection was higher for patients in the sirolimus group 11/131 (8.4%) compared to the tacrolimus group 2/123 (1.6%) through 2 years post-transplant. The rate of new-onset diabetes mellitus post-randomization, defined as 30 days or longer of continuous or at least 25 days non-stop (without gap) use of any diabetic treatment after randomization, a fasting glucose ≥126 mg/dL or a non-fasting glucose ≥200 mg/dL, was higher in the sirolimus group 15/82 (18.3%) compared to the tacrolimus group 4/72 (5.6%). A greater incidence of proteinuria, was seen in the sirolimus group 19/131 (14.5%) versus 2/123 (1.6%) in the tacrolimus group.
14.5 Conversion from a CNI-based Regimen to a Sirolimus-based Regimen in
Liver Transplant Patients
Conversion from a CNI-based regimen to a sirolimus-based regimen was assessed in stable liver transplant patients 6 to 144 months post-transplant. The clinical study was a 2:1 randomized, multi-center, controlled trial conducted at 82 centers globally, including the US and Europe, and was intended to show that renal function was improved by conversion from a CNI to sirolimus without adversely impacting efficacy or safety. A total of 607 patients were enrolled.
The study failed to demonstrate superiority of conversion to a sirolimus-based regimen compared to continuation of a CNI-based regimen in baseline-adjusted GFR, as estimated by Cockcroft-Gault, at 12 months (62 mL/min in the sirolimus conversion group and 63 mL/min in the CNI continuation group). The study also failed to demonstrate non-inferiority, with respect to the composite endpoint consisting of graft loss and death (including patients with missing survival data) in the sirolimus conversion group compared to the CNI continuation group (6.6% versus 5.6%). The number of deaths in the sirolimus conversion group (15/393, 3.8%) was higher than in the CNI continuation group (3/214, 1.4%), although the difference was not statistically significant. The rates of premature study discontinuation (primarily due to adverse events or lack of efficacy), adverse events overall (infections, specifically), and biopsy- proven acute liver graft rejection at 12 months were all significantly greater in the sirolimus conversion group compared to the CNI continuation group.
14.6 Pediatric Renal Transplant Patients
Sirolimus was evaluated in a 36-month, open-label, randomized, controlled clinical trial at 14 North American centers in pediatric (aged 3 to < 18 years) renal transplant patients considered to be at high-immunologic risk for developing chronic allograft nephropathy, defined as a history of one or more acute allograft rejection episodes and/or the presence of chronic allograft nephropathy on a renal biopsy. Seventy-eight (78) subjects were randomized in a 2:1 ratio to sirolimus (sirolimus target concentrations of 5 to 15 ng/mL, by chromatographic assay, n = 53) in combination with a calcineurin inhibitor and corticosteroids or to continue calcineurin-inhibitor-based immunosuppressive therapy (n = 25). The primary endpoint of the study was efficacy failure as defined by the first occurrence of biopsy-confirmed acute rejection, graft loss, or death, and the trial was designed to show superiority of sirolimus added to a calcineurin-inhibitor-based immunosuppressive regimen compared to a calcineurin-inhibitor-based regimen. The cumulative incidence of efficacy failure up to 36 months was 45.3% in the sirolimus group compared to 44% in the control group, and did not demonstrate superiority. There was one death in each group. The use of sirolimus in combination with calcineurin inhibitors and corticosteroids was associated with an increased risk of deterioration of renal function, serum lipid abnormalities (including, but not limited to, increased serum triglycerides and cholesterol), and urinary tract infections [see Warnings and Precautions (5.8)]. This study does not support the addition of sirolimus to calcineurin-inhibitor-based immunosuppressive therapy in this subpopulation of pediatric renal transplant patients.
14.7 Lymphangioleiomyomatosis Patients
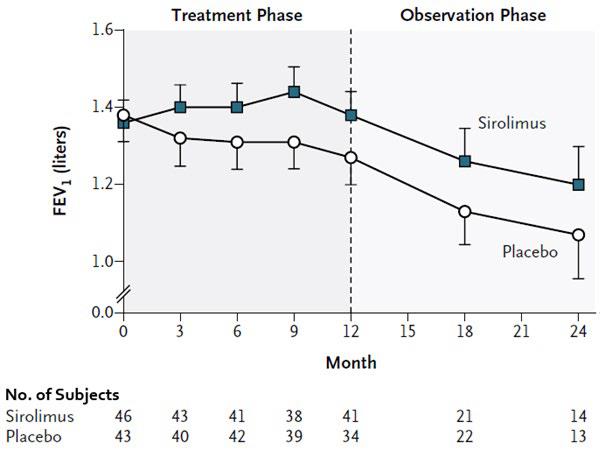
The safety and efficacy of sirolimus for treatment of lymphangioleiomyomatosis (LAM) were assessed in a randomized, double-blind, multicenter, controlled trial. This study compared sirolimus (dose-adjusted to maintain blood trough concentrations between 5- to 15 ng/mL) with placebo for a 12-month treatment period, followed by a 12-month observation period. Eighty-nine (89) patients were enrolled; 43 patients were randomized to receive placebo and 46 patients to receive sirolimus. The primary endpoint was the difference between the groups in the rate of change (slope) per month in forced expiratory volume in 1 second (FEV1). During the treatment period, the FEV1 slope was -12±2 mL per month in the placebo group and 1±2 mL per month in the sirolimus group (treatment difference = 13 mL (95% CI: 7, 18). The absolute between-group difference in the mean change in FEV1 during the 12-month treatment period was 153 mL, or approximately 11% of the mean FEV1 at enrollment. Similar improvements were seen for forced vital capacity (FVC). After discontinuation of sirolimus, the decline in lung function resumed in the sirolimus group and paralleled that in the placebo group (see Figure 1).
The rate of change over 12 months of vascular endothelial growth factor-D (VEGF-D), a lymphangiogenic growth factor which has been shown to be elevated in patients with LAM, was significantly different in the sirolimus-treated group (-88 ± 16.6 pg/mL/month) compared to placebo (-2.42 ± 17.2 pg/mL/month) with a treatment difference of -86 pg/mL/month (95% CI: -133, -39). The absolute between-group difference in the mean change in VEGF-D during the 12-month treatment period was -1017.2, or approximately 50% of the mean VEGF-D at enrollment.
INSTRUCTIONS FOR USE SECTION
INSTRUCTIONS FOR USE
Sirolimus Oral Solution
(sir oh' li mus)
Be sure that you read and understand the following instructions for the correct way to dilute and take sirolimus oral solution. Ask your pharmacist or doctor if you are not sure.
Important:
- Always keep the bottle in an upright position.
- You may store sirolimus oral solution that is in a syringe at room temperature up to 77°F (25°C) or in the refrigerator at 36°F to 46°F (2°C to 8°C) for up to 24 hours. See "How should I store sirolimus oral solution?" at the end of this Instructions for Use.
- Sirolimus oral solution can develop a slight haze when it is refrigerated. If this happens, bring the sirolimus oral solution to room temperature and then gently shake the bottle until the haze goes away.
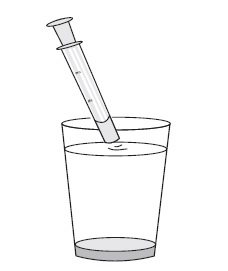
- Only use a glass or plastic cup to dilute sirolimus oral solution.
- If you are a caregiver, do not let sirolimus oral solution come in contact with your skin or eyes. If you get the oral solution on your skin, wash the area well with soap and water.
- If you get the oral solution in your eyes, rinse with plain water. If you spill sirolimus oral solution, dry the area with a dry paper towel and then wipe the area with a wet paper towel. Throw away the paper towels in the trash and wash your hands well with soap and water.
Each sirolimus oral solution carton contains:
|
|
|
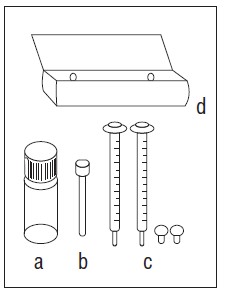
You will also need:
- glass or plastic cup
- 6 oz. of water or orange juice only
|
|
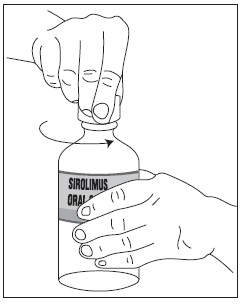
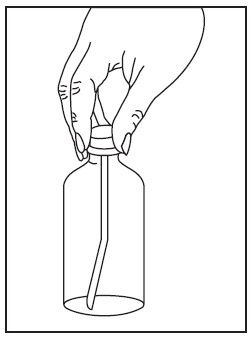
1. Open the solution bottle.
|
|
|
2. Thefirst time you use a bottle of sirolimus oral solution:
|
|
|
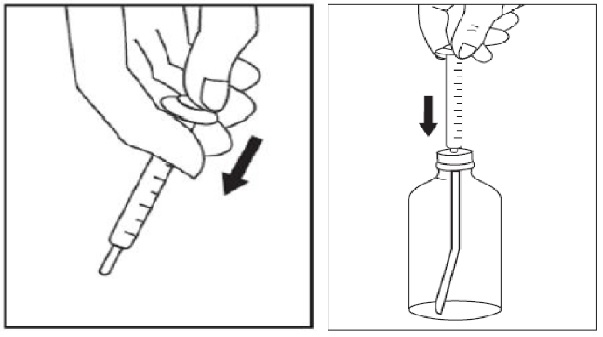
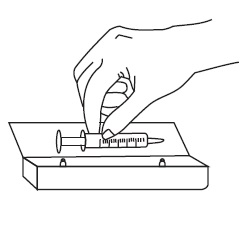
3. Use a new disposable amber oral syringe for each dose of sirolimus oral solution.
|
|
|
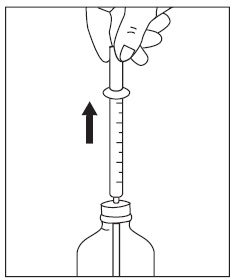
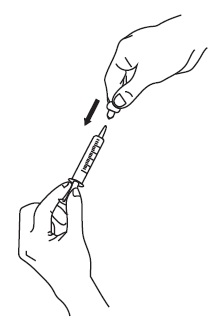
4. Withdraw the prescribed amount of sirolimus oral solution:
|
|
|
5. If your doctor tells you to carry your medicine with you:
|
|
|
|
|
|
6. Taking a dose of sirolimus oral solution:
|
|
7. Always store the bottles of medication in the refrigerator. |
How should I store sirolimus oral solution?
- Store bottles of sirolimus oral solution in the refrigerator at 36°F to 46°F (2°C to 8°C).
- Protect from light.
- Store sirolimus oral solution that is in a syringe at room temperature up to 77°F (25°C) or in the refrigerator at 36°F to 46°F (2°C to 8°C) for up to 24 hours.
- If necessary, bottles of sirolimus oral solution can be stored at room temperature up to 77°F (25°C) for up to 15 days.
- When a bottle of sirolimus oral solution is opened, it should be used within 1 month.
- Use any diluted sirolimus oral solution right away.
Keep sirolimus oral solution and all medicines out of the reach of children.
This Instructions for Use has been approved by the U.S. Food and Drug Administration.
APOTEX INC.
SIROLIMUS ORAL SOLUTION
** 1 mg/mL**
|
Manufactured By |
Manufactured For |
|
Apotex Inc. |
Apotex Corp. |
|
Toronto, Ontario |
Weston, Florida |
|
Canada M9L 1T9 |
USA 33326 |
Revised: July 2023
Rev. 8
DESCRIPTION SECTION
11 DESCRIPTION
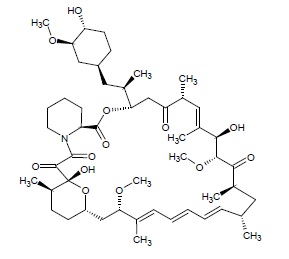
Sirolimus is an mTOR inhibitor immunosuppressive agent. Sirolimus is a macrocyclic lactone produced by Streptomyces hygroscopicus. The chemical name of sirolimus (also known as rapamycin) is (2S, 10R, 11R, 14S, 16S, 18E, 20E, 22E, 23S, 25R, 27R, 28R, 30E, 31R, 34S)- 2, 3, 4, 5, 10, 11, 12, 13, 14, 15, 16, 23, 24, 25, 27, 28-hexadecahydro-10, 28-dihydroxy-34-[(1R)-2-[(1S,3R,4R)-4-hydroxy-3-methoxycyclohexyl]-1-methylethyl]- 16, 27-dimethoxy-11, 17, 23, 25, 29,31-hexamethyl-10,14-epoxy-34H-pyrido[2,1-c][1,4]-oxaazacyclohentriacontine-1, 8, 9, 26,32 (6H, 31H, 33H)-pentone. Its molecular formula is C51H79NO13 and its molecular weight is 914.17 g/mol. The structural formula of sirolimus is illustrated as follows.
Sirolimus is a white to off-white powder and is insoluble in water, but freely soluble in ether, chloroform, acetone, methanol, dimethylformamide, isopropanol and ethyl acetate.
Sirolimus is available for administration as an oral solution containing 1 mg/mL sirolimus.
The inactive ingredients in sirolimus oral solution are Phosal 50 PG® (ascorbyl palmitate, ethanol, lysophosphatidylcholine, phosphatidylcholine, propylene glycol, sunflower mono- diglycerides, and water) and polysorbate 80. Sirolimus oral solution contains 1.5% to 2.5% ethanol.