
ZEPBOUND
These highlights do not include all the information needed to use ZEPBOUND safely and effectively. See full prescribing information for ZEPBOUND. ZEPBOUND (tirzepatide) Injection, for subcutaneous useInitial U.S. Approval:
487cd7e7-434c-4925-99fa-aa80b1cc776b
HUMAN PRESCRIPTION DRUG LABEL
Nov 9, 2023
Eli Lilly and Company
DUNS: 006421325
Products 10
Detailed information about drug products covered under this FDA approval, including NDC codes, dosage forms, ingredients, and administration routes.
tirzepatide
Product Details
FDA regulatory identification and product classification information
FDA Identifiers
Product Classification
Product Specifications
INGREDIENTS (6)
tirzepatide
Product Details
FDA regulatory identification and product classification information
FDA Identifiers
Product Classification
Product Specifications
INGREDIENTS (6)
tirzepatide
Product Details
FDA regulatory identification and product classification information
FDA Identifiers
Product Classification
Product Specifications
INGREDIENTS (6)
tirzepatide
Product Details
FDA regulatory identification and product classification information
FDA Identifiers
Product Classification
Product Specifications
INGREDIENTS (6)
tirzepatide
Product Details
FDA regulatory identification and product classification information
FDA Identifiers
Product Classification
Product Specifications
INGREDIENTS (6)
tirzepatide
Product Details
FDA regulatory identification and product classification information
FDA Identifiers
Product Classification
Product Specifications
INGREDIENTS (6)
tirzepatide
Product Details
FDA regulatory identification and product classification information
FDA Identifiers
Product Classification
Product Specifications
INGREDIENTS (6)
tirzepatide
Product Details
FDA regulatory identification and product classification information
FDA Identifiers
Product Classification
Product Specifications
INGREDIENTS (6)
tirzepatide
Product Details
FDA regulatory identification and product classification information
FDA Identifiers
Product Classification
Product Specifications
INGREDIENTS (6)
tirzepatide
Product Details
FDA regulatory identification and product classification information
FDA Identifiers
Product Classification
Product Specifications
INGREDIENTS (6)
Drug Labeling Information
PACKAGE LABEL.PRINCIPAL DISPLAY PANEL
PACKAGE LABEL - Zepbound**®****, 15 mg/0.5 mL, Carton, Single-dose Vial**
NDC 0002-2002-01
Zepbound®
(tirzepatide) injection
15 mg/0.5 mL
Single-dose Vial - discard unused portion
Rx Only
For Subcutaneous Use
Needles and Syringes are not included
Dispense enclosed Medication Guide to each patient.
Lilly
CLINICAL STUDIES SECTION
14 CLINICAL STUDIES
14.1 Weight Reduction and Long-Term Maintenance Studies in Adults with
Obesity or Overweight
Weight Reduction in Adults with Obesity or Overweight, with or without Type 2 Diabetes Mellitus (Study 1 and Study 2)
Overview of Study 1 and Study 2
The efficacy of ZEPBOUND for weight reduction in conjunction with a reduced- calorie diet and increased physical activity was studied in two randomized, double-blind, placebo-controlled fixed-dosage trials (Study 1 and Study 2) in adults aged 18 years and older. In Studies 1 and 2, all patients received a standard lifestyle intervention which included instruction on a reduced- calorie diet (approximately 500 kcal/day deficit) and increased physical activity counseling (recommended minimum of 150 min/week) that began with the first dose of study medication or placebo and continued throughout the trial. Patients also received counseling on behavior modification strategies to adhere to diet and exercise recommendations. In both trials, weight reduction was assessed after 72 weeks of treatment (at least 52 weeks at maintenance dose).
Study 1 (NCT04184622) was a 72-week trial that enrolled 2,539 adult patients with obesity (BMI ≥30 kg/m2), or with overweight (BMI 27 to <30 kg/m2) and at least one weight-related comorbid condition, such as dyslipidemia, hypertension, obstructive sleep apnea, or cardiovascular disease; patients with type 2 diabetes mellitus were excluded. Patients were randomized in a 1:1:1:1 ratio to once weekly fixed dosage of ZEPBOUND 5 mg, ZEPBOUND 10 mg, ZEPBOUND 15 mg, or placebo, with an escalation period of up to 20 weeks followed by the maintenance period. At baseline, mean age was 45 years (range 18-84 years), 68% were female, 71% were White, 11% were Asian, 9% were American Indian/Alaska Native, and 8% were Black or African American. A total of 48% were Hispanic or Latino ethnicity. Mean baseline body weight was 104.8 kg and mean BMI was 38 kg/m2. Baseline characteristics included 32% with hypertension, 30% with dyslipidemia, 8% with obstructive sleep apnea, and 3% with cardiovascular disease.
Study 2 (NCT04657003) was a 72-week trial that enrolled 938 adult patients with BMI ≥27 kg/m2 and type 2 diabetes mellitus. Patients included in the trial had HbA1c 7-10% and were treated with either diet and exercise alone, or any oral anti-hyperglycemic agent except dipeptidyl peptidase-4 (DPP-4) inhibitors or GLP-1 receptor agonists. Patients who were taking insulin or injectable GLP-1 receptor agonists for type 2 diabetes mellitus were excluded. Patients were randomized in a 1:1:1 ratio to once weekly fixed dosage of ZEPBOUND 10 mg, ZEPBOUND 15 mg, or placebo with an escalation period of up to 20 weeks followed by the maintenance period. At baseline, mean age was 54 years (range 18-85 years), 51% were female, 76% were White, 13% were Asian, and 8% were Black or African American. A total of 60% were Hispanic or Latino ethnicity. Mean baseline body weight was 100.7 kg and mean BMI was 36.1 kg/m2. Baseline characteristics included 66% with hypertension, 61% with dyslipidemia, 8% with obstructive sleep apnea, and 10% with cardiovascular disease.
Results for Study 1 and Study 2
The proportions of patients who discontinued study drug in Study 1 were 14.3%, 16.4%, and 15.1% for the 5 mg, 10 mg, and 15 mg ZEPBOUND-treated groups, respectively, and 26.4% for the placebo-treated group. The proportions of patients who discontinued study drug in Study 2 were 9.3% and 13.8% for the 10 mg and 15 mg ZEPBOUND-treated groups, respectively, and 14.9% for the placebo- treated group.
For Studies 1 and 2, weight reduction was assessed after 72 weeks of treatment (at least 52 weeks at maintenance dose). In both studies, the primary efficacy parameters were mean percent change in body weight and the percentage of patients achieving ≥5% weight reduction from baseline to Week 72 (see Table 2).
After 72 weeks of treatment, ZEPBOUND resulted in a statistically significant reduction in body weight compared with placebo, and greater proportions of patients treated with ZEPBOUND 5 mg, 10 mg, and 15 mg achieved at least 5% weight reduction compared to placebo. Among patients treated with ZEPBOUND 10 mg and 15 mg, greater proportions of patients achieved at least 10%, 15%, and 20% weight reduction compared to placebo (see Table 2). A reduction in body weight was observed with ZEPBOUND irrespective of age, sex, race, ethnicity, baseline BMI, and glycemic status.
Table 2: Changes in Body Weight at Week 72 in Studies 1 and 2 in Patients with Obesity or Overweight|
Abbreviations: ANCOVA = analysis of covariance; CI = confidence interval; N = number of patients randomly assigned to study drug. | |||||||
|
a The intention-to-treat population includes all randomly assigned patients. For Study 1 at Week 72, body weight was missing for 21.6%, 10.2%, 10.5%, and 9.4% of patients randomly assigned to placebo, ZEPBOUND 5 mg, 10 mg, and 15 mg, respectively. For Study 2 at Week 72, body weight was missing for 11.1%, 4.8%, and 8.4% of patients randomly assigned to placebo, ZEPBOUND 10 mg, and 15 mg, respectively. The missing values were imputed by a hybrid approach using retrieved dropouts from the same treatment group (if missing not due to COVID-19) or using all non-missing data assuming missing at random (for missing solely due to COVID-19). | |||||||
|
b Least-squares mean from ANCOVA adjusted for baseline value and other stratification factors. | |||||||
|
c Analyzed using logistic regression adjusted for baseline value. | |||||||
|
d p-value<0.001 (unadjusted 2-sided) for superiority, controlled for type I error rate. | |||||||
|
e Not controlled for type I error rate. | |||||||
|
Study 1 |
Study 2 | ||||||
|
Intention-to-Treat (ITT) Populationa |
****Placebo |
ZEPBOUND |
ZEPBOUND |
ZEPBOUND |
Placebo |
ZEPBOUND |
ZEPBOUND |
|
Body Weight | |||||||
|
Baseline mean (kg) |
104.8 |
102.9 |
105.8 |
105.6 |
101.7 |
100.9 |
99.6 |
|
% Change from baselineb |
-3.1 |
-15.0 |
-19.5 |
-20.9 |
-3.2 |
-12.8 |
-14.7 |
|
% Difference from placebob |
-11.9 |
-16.4 |
-17.8 |
-9.6 |
-11.6 | ||
|
% of Patients losing ≥5% body weight |
34.5 |
85.1 |
88.9 |
90.9 |
32.5 |
79.2 |
82.8 |
|
% Difference from placebo |
50.3 |
54.6 |
56.4 |
46.8 |
50.4 | ||
|
% of Patients losing ≥10% body weight |
18.8 |
68.5 |
78.1 |
83.5 |
9.5 |
60.5 |
64.8 |
|
% Difference from placebo |
49.3 |
59.5 |
64.8 |
51.0 |
55.3 | ||
|
% of Patients losing ≥15% body weight |
8.8 |
48.0 |
66.6 |
70.6 |
2.7 |
39.7 |
48.0 |
|
% Difference from placebo |
38.7 |
58.1 |
62.0 |
37.0 |
45.4 | ||
|
% of Patients losing ≥20% body weight |
3.1 |
30.0 |
50.1 |
56.7 |
1.0 |
21.5 |
30.8 |
|
% Difference from placebo |
26.6 |
47.3 |
53.8 |
20.5 |
29.7 |
The cumulative frequency distributions of change in body weight are shown in Figure 1 for Study 1 and Figure 2 for Study 2. One way to interpret this figure is to select a change in body weight of interest on the horizontal axis and note the corresponding proportions of patients (vertical axis) in each treatment group who achieved at least that degree of weight reduction. For example, note that the vertical line arising from -10% in Figure 1 intersects the ZEPBOUND 15 mg and placebo curves at approximately 83.5%, and 18.8%, respectively, which correspond to the values shown in Table 2.
Figure 1: Changes in Body Weight (%) from Baseline to Week 72 in Study 1 in Patients with Obesity or Overweight (without Type****2 Diabetes)
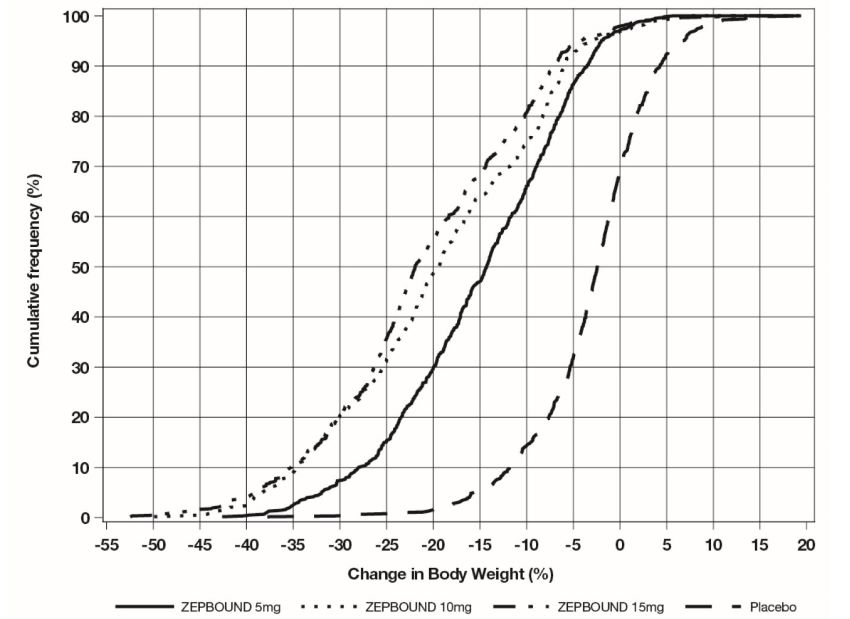
Note: Based on average percent weight change of each randomized patient within each specific treatment arm from 100 imputed datasets including observed data and imputed data using hybrid approach for missing values.
Figure 2: Changes in Body Weight (%) from Baseline to Week 72 in Study 2 in Patients with Obesity or Overweight and Type****2 Diabetes
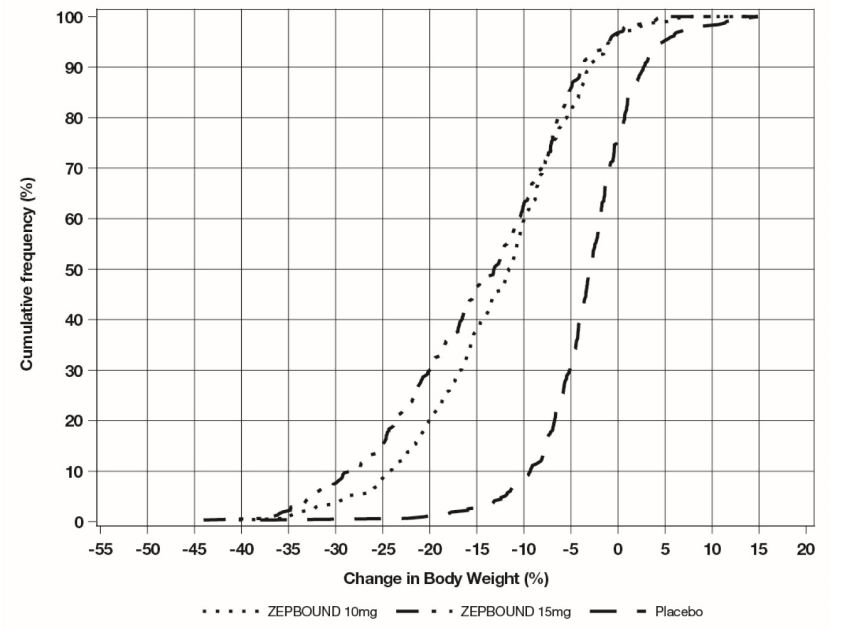
Note: Based on average percent weight change of each randomized patient within each specific treatment arm from 100 imputed datasets including observed data and imputed data using hybrid approach for missing values.
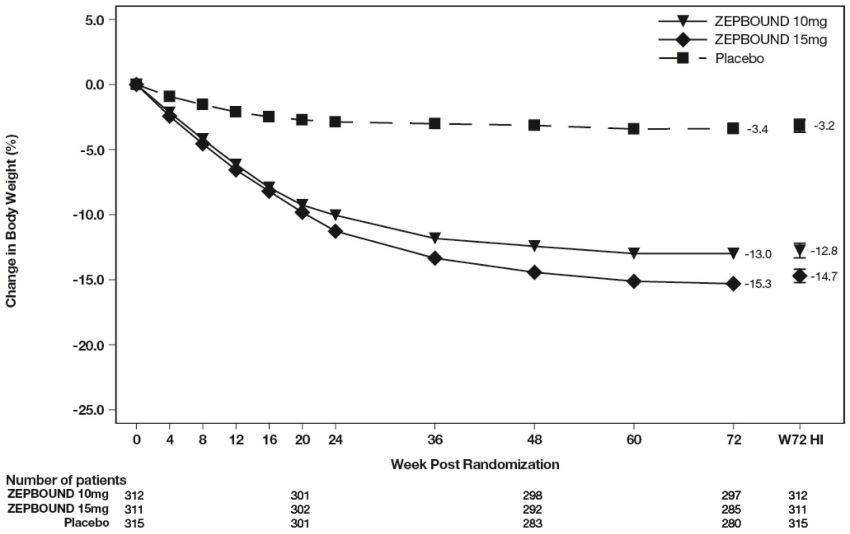
The time courses of weight reduction with ZEPBOUND and placebo from baseline through Week 72 are depicted in Figure 3 for Study 1 and Figure 4 for Study 2.
Figure 3: Change from Baseline (%) in Body Weight in Study 1 in Patients with Obesity or Overweight (without Type****2 Diabetes)
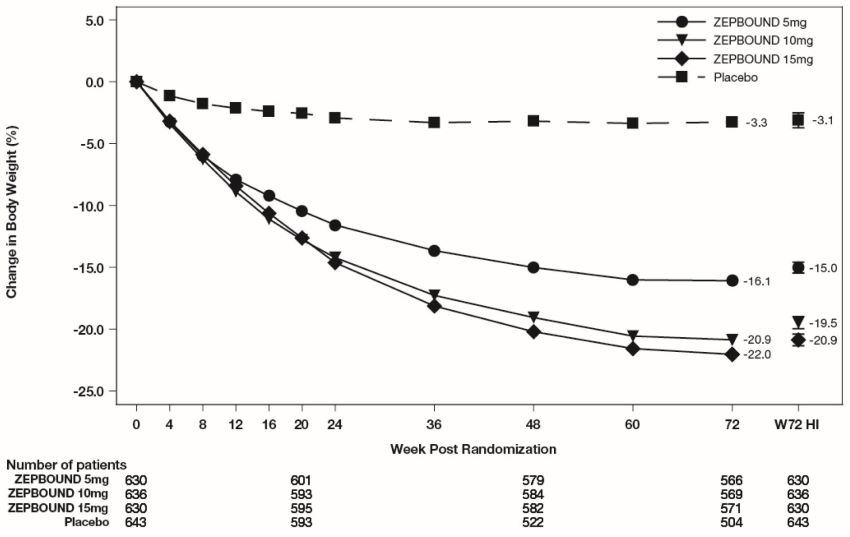
Note: Displayed results are from the Intent-to-Treat Population. (1) Observed mean value from Week 0 to Week 72, and (2) least-squares mean ± standard error at Week 72 hybrid imputation (HI).
Figure 4: Change from Baseline (%) in Body Weight in Study 2 in Patients with Obesity or Overweight and Type****2 Diabetes
Note: Displayed results are from the Intent-to-Treat Population. (1) Observed mean value from Week 0 to Week 72, and (2) least squares mean ± standard error at Week 72 hybrid imputation (HI).
Changes in waist circumference and cardiometabolic parameters with ZEPBOUND are shown in Table 3 for Study 1 and Study 2.
Table 3: Changes in Anthropometry and Cardiometabolic Parameters at Week 72 in Studies 1 and 2 in Patients with Obesity or Overweight|
Abbreviations: ANCOVA = analysis of covariance; CI = confidence interval; N = number of patients randomly assigned to study drug. | |||||||
|
a The intention-to-treat population includes all randomly assigned patients. The missing values were imputed by a hybrid approach using retrieved dropouts from the same treatment group (if missing not due to COVID-19) or using all non-missing data assuming missing at random (for missing solely due to COVID-19). | |||||||
|
b Least-squares mean from ANCOVA adjusted for baseline value and other stratification factors. | |||||||
|
c Analyzed using log-transformed data. | |||||||
|
d p-value<0.001 (unadjusted 2-sided) for superiority, controlled for type I error rate. | |||||||
|
e Not controlled for type I error rate. | |||||||
|
f Least-squares mean from mixed model for repeated measures adjusted for baseline value and other stratification factors. | |||||||
|
g Baseline value is the geometric mean. | |||||||
|
Study 1 |
Study 2 | ||||||
|
Intention-to-Treat (ITT) Populationa |
****Placebo |
ZEPBOUND |
ZEPBOUND |
ZEPBOUND |
Placebo |
ZEPBOUND |
ZEPBOUND |
|
Waist Circumference (cm) | |||||||
|
Baseline mean |
114.0 |
113.2 |
114.8 |
114.4 |
116.0 |
114.2 |
114.6 |
|
Change from baselineb |
-4.0 |
-14.0 |
-17.7 |
-18.5 |
-3.3 |
-10.8 |
-13.1 |
|
Difference from |
-10.1 |
-13.8 |
-14.5 |
-7.4 |
-9.8 | ||
|
Systolic Blood Pressure (mmHg) | |||||||
|
Baseline mean |
122.9 |
123.6 |
123.8 |
123.0 |
131.0 |
130.6 |
130.0 |
|
Change from baselineb |
-1.0 |
-6.6 |
-7.7 |
-7.4 |
-1.2 |
-5.6 |
-7.1 |
|
Difference from |
-5.6 |
-6.7 |
-6.4 |
-4.4 |
-5.9 | ||
|
Diastolic Blood Pressure (mmHg) | |||||||
|
Baseline mean |
79.6 |
79.3 |
79.9 |
79.3 |
79.4 |
80.2 |
79.7 |
|
Change from baselineb |
-0.8 |
-4.9 |
-5.0 |
-4.5 |
-0.3 |
-2.1 |
-2.9 |
|
Difference from |
-4.1 |
-4.2 |
-3.7 |
-1.8 |
-2.7 | ||
|
Pulse Rate (beats per minute) | |||||||
|
Baseline mean |
72.9 |
72.4 |
71.8 |
72.4 |
74.8 |
75.9 |
75.6 |
|
Change from baselinef |
0.1 |
0.6 |
2.3 |
2.6 |
-0.5 |
0.6 |
1.0 |
|
Difference from |
0.5 |
2.2 |
2.5 |
1.2 |
1.5 | ||
|
Total Cholesterol (mg/dL) | |||||||
|
Baseline meang |
187.5 |
187.1 |
190.6 |
187.5 |
174.9 |
173.9 |
167.0 |
|
% change from |
-1.8 |
-3.8 |
-4.4 |
-6.3 |
2.8 |
-2.8 |
-1.0 |
|
Relative difference |
-2.1 |
-2.7 |
-4.6 |
-5.5 |
-3.8 | ||
|
LDL Cholesterol (mg/dL) | |||||||
|
Baseline meang |
109.4 |
108.7 |
112.3 |
109.3 |
92.4 |
90.5 |
85.7 |
|
% change from |
-1.7 |
-4.6 |
-5.6 |
-7.1 |
7.4 |
1.8 |
4.1 |
|
Relative difference |
-2.9 |
-4.0 |
-5.5 |
-5.2 |
-3.0 | ||
|
HDL Cholesterol (mg/dL) | |||||||
|
Baseline meang |
46.6 |
47.6 |
47.6 |
47.6 |
42.7 |
43.8 |
42.2 |
|
% change from |
-0.7 |
6.9 |
9.2 |
8.0 |
0.2 |
8.2 |
9.7 |
|
Relative difference |
7.7 |
9.9 |
8.7 |
8.0 |
9.5 | ||
|
Non-HDL Cholesterol (mg/dL) | |||||||
|
Baseline meang |
138.3 |
137.0 |
140.4 |
137.5 |
129.6 |
127.2 |
121.9 |
|
% change from |
-2.3 |
-8.0 |
-9.4 |
-11.7 |
3.7 |
-6.6 |
-5.2 |
|
Relative difference |
-5.8 |
-7.2 |
-9.6 |
-9.9 |
-8.5 | ||
|
Triglycerides (mg/dL) | |||||||
|
Baseline meang |
130.8 |
128.7 |
125.7 |
128.1 |
165.0 |
158.8 |
158.5 |
|
% change from |
-5.6 |
-21.2 |
-23.8 |
-29.1 |
-3.3 |
-27.1 |
-27.3 |
|
Relative difference |
-16.5 |
-19.3 |
-24.9 |
-24.6 |
-24.8 | ||
|
HbA1c (%) | |||||||
|
Baseline mean |
5.6 |
5.6 |
5.5 |
5.6 |
8.0 |
8.0 |
8.1 |
|
Change from baselineb |
-0.1 |
-0.4 |
-0.4 |
-0.4 |
-0.5 |
-2.1 |
-2.1 |
|
Difference from |
-0.3 |
-0.4 |
-0.4 |
-1.6 |
-1.6 |
Weight Reduction Following Intensive Lifestyle Intervention in Adults with Obesity or Overweight (Study 3)
Overview of Study 3
Study 3 (NCT04657016) was an 84-week trial with a 12-week intensive lifestyle intervention lead-in period (Week -12 to Week 0), followed by a 72-week randomized treatment period of ZEPBOUND versus placebo (Week 0 to Week 72) with a standard lifestyle intervention. Only patients who lost ≥5% body weight during the 12-week intensive lifestyle lead-in period entered the 72-week randomized treatment period. The trial initially enrolled 806 adult patients (aged 18 years and older) with obesity (BMI ≥30 kg/m2), or with overweight (BMI 27 to <30 kg/m2) and at least one weight-related comorbid condition, such as dyslipidemia, hypertension, obstructive sleep apnea, or cardiovascular disease; patients with type 2 diabetes mellitus were excluded. During the intensive lifestyle intervention lead-in period, lifestyle instruction was delivered 8 times over 12 weeks by a dietician or dietician-equivalent, with all patients receiving instruction to exercise for at least 150 minutes per week and to reduce their caloric intake to approximately 1,200 kcal/day (females) or 1,500 kcal/day (males). Patients also received counseling on behavior modification strategies to adhere to diet and exercise recommendations. At the end of the 12-week intensive lifestyle intervention lead-in period, 579 patients who achieved ≥5% weight reduction were randomized in a 1:1 ratio to ZEPBOUND or placebo for 72 weeks. ZEPBOUND dosages were escalated over a period of up to 20 weeks to a maximum tolerated dosage (MTD) of 10 mg or 15 mg subcutaneous once weekly. During the randomized treatment period, patients received a standard lifestyle instruction every 12 weeks on reduced-calorie diet (approximately 500 kcal/day deficit) and increased physical activity (recommended minimum of 150 min/week) that began with the first dose of ZEPBOUND or placebo and continued throughout the 72-week treatment period; behavior modification strategies were recommended as needed. Weight reduction was assessed after 72 weeks of treatment (at least 52 weeks at maintenance dose).
For the 579 patients who were randomized, mean body weight at enrollment prior to entering the 12-week lifestyle lead-in period (Week -12) was 109.5 kg and mean BMI was 38.6 kg/m2. At randomization (Week 0), after the 12-week intensive lifestyle lead-in period, mean body weight was 101.9 kg and mean BMI was 35.9 kg/m2. The mean age of patients randomized to treatment was 46 years (range 18-77 years), 63% were female, 86% were White, 11% were Black or African American, and 1% were Asian. A total of 54% were Hispanic or Latino ethnicity. Baseline characteristics for the 579 randomized patients included 34% with hypertension, 26% with dyslipidemia, 10% with obstructive sleep apnea, and 2% with cardiovascular disease.
Results for Study 3
At the end of the 12-week intensive lifestyle intervention lead-in, for patients who subsequently entered the randomized treatment period (n=579), the average body weight loss due to lifestyle was 6.9% (Week -12 to Week 0). Eighty-six percent (86%) of ZEPBOUND-treated patients had a maximum tolerated dosage of 15 mg weekly based on their final dose during the double-blind treatment period. The time course of weight reduction during the lead-in and from Week 0 to Week 72 with ZEPBOUND and placebo are depicted in Figure 5.
Figure 5: Change in Body Weight (%) After 12-Week Intensive Lifestyle Intervention Lead-In Followed by Randomized Treatment and a Standard Lifestyle Intervention (Study 3) in Patients with Obesity or Overweight
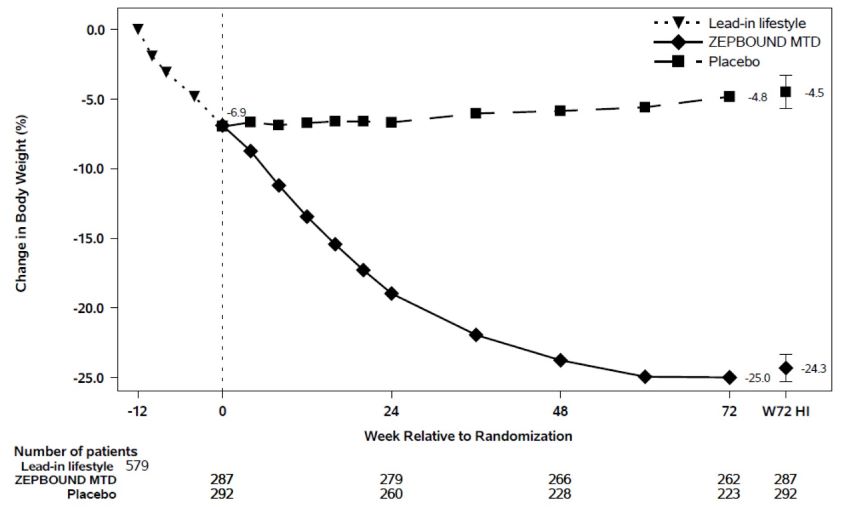
Note: Displayed results are from the randomized Population. (1) Observed mean value from Week -12 to Week 72, and (2) least squares mean ± standard error at Week 72 hybrid imputation (HI). Change from Week -12 is not a primary endpoint in Study 3.
The proportions of patients who discontinued study drug after randomization were 21.3% for the ZEPBOUND-treated group and 30.5% for the placebo-treated group.
For Study 3, the primary efficacy parameters were mean percent change in body weight from randomization (Week 0) to Week 72 and the percentage of patients achieving ≥5% weight reduction from randomization (Week 0) to Week 72. Amongst randomized patients who already lost ≥5% body weight during the 12-week intensive lifestyle lead-in period, subsequent treatment with ZEPBOUND resulted in a statistically significant reduction in body weight compared to placebo from randomization (Week 0) to Week 72. A greater proportion of patients treated with ZEPBOUND achieved at least 5%, 10%, 15%, and 20% weight reduction from Week 0 to Week 72 compared to placebo (see Table 4).
Table 4: Changes in Body Weight After 12-Week Intensive Lifestyle Intervention Lead-In Followed by Randomized Treatment and a Standard Lifestyle Intervention (Study 3) in Patients with Obesity or Overweight|
Abbreviations: ANCOVA = analysis of covariance; CI = confidence interval; MTD = maximum tolerated dose; N = number of patients randomly assigned to study drug. | ||
|
a The intent-to-treat population included only randomized patients with ≥5% weight loss at Week 0 after 12 weeks of intensive lifestyle intervention. During the 12-week lead-in period, 227 of 806 patients (28.2%) discontinued from the study. Of these 141 (17.5%) discontinued due to not achieving the randomization criteria of ≥5% weight reduction. | ||
|
b The intent-to-treat population includes all randomly assigned patients. For Study 3 at Week 72, body weight was missing for 23.6% and 8.7% of patients randomly assigned to placebo and ZEPBOUND MTD (10 or 15 mg). The missing values were imputed by a hybrid approach using retrieved dropouts from the same treatment group (if missing not due to COVID-19) or using all non-missing data assuming missing at random (for missing solely due to COVID-19). | ||
|
c Least-squares mean from ANCOVA adjusted for baseline value and other stratification factors. | ||
|
d Analyzed using logistic regression adjusted for baseline value. | ||
|
e p-value<0.001 (unadjusted 2-sided) for superiority, controlled for type I error rate. | ||
|
Study 3 | ||
|
Body weight | ||
|
Mean (kg) at Week -12 |
109.5 | |
|
Intention-to-Treat (ITT) Populationa,b |
**Placebo |
ZEPBOUND |
|
Body Weight | ||
|
Mean (kg) at Week 0 |
101.3 |
102.5 |
|
% Change from randomization at Week 72c |
2.5 |
-18.4 |
|
% Difference from placebo, at Week 72c |
-20.8 | |
|
% of Patients losing ≥5% body weight |
16.5 |
87.5 |
|
% Difference from placebo |
71.1 | |
|
% of Patients losing ≥10% body weight |
8.9 |
76.7 |
|
% Difference from placebo |
67.9 | |
|
% of Patients losing ≥15% body weight |
4.2 |
65.4 |
|
% Difference from placebo |
61.3 | |
|
% of Patients losing ≥20% body weight |
2.2 |
44.7 |
|
% Difference from placebo |
42.6 |
Changes in waist circumference and cardiometabolic parameters are shown in Table 5.
Table 5: Changes in Anthropometry and Cardiometabolic Parameters After 12-Week Intensive Lifestyle Intervention Lead-In Followed by Randomized Treatment and a Standard Lifestyle Intervention (Study 3) in Patients with Obesity or Overweight|
Abbreviations: ANCOVA = analysis of covariance; CI = confidence interval; N = number of patients randomly assigned to study drug. | |||||||
|
a The intent-to-treat population included all randomly assigned patients. The missing values were imputed by a hybrid approach using retrieved dropouts from the same treatment group (if missing not due to COVID-19) or using all non- missing data assuming missing at random (for missing solely due to COVID-19). | |||||||
|
b Least-squares mean from ANCOVA adjusted for baseline value and other stratification factors. | |||||||
|
c Analyzed using log-transformed data. | |||||||
|
d p-value<0.001 (unadjusted 2-sided) for superiority, controlled for type I error rate. | |||||||
|
e Not controlled for type I error rate. | |||||||
|
f Least-squares mean from mixed model for repeated measures adjusted for baseline value and other stratification factors. | |||||||
|
g Baseline and randomization values are the geometric mean. | |||||||
|
h Observed means are shown for change from Week -12 to Week 0. Least-square means are shown for change from Week 0 to Week 72. | |||||||
|
Intention-to-Treat (ITT) Populationa |
All Randomized Patients**** |
Placebo |
ZEPBOUND MTD (10mg or 15mg) | ||||
|
Baseline (Week**-**12) |
Change from Week**-**12 to Week 0 |
Randomization (Week 0) |
Change from Week 0 to Week 72 |
Randomization (Week 0) |
Change from Week 0 to Week 72 |
Difference from placebo, Week 0 to Week 72**** | |
|
Waist circumference (cm)h |
116.1 |
-6.7 |
109.6 |
0.2b |
109.3 |
-14.6b |
-14.8b |
|
Systolic Blood Pressure (mmHg)h |
126.2 |
-5.0 |
120.8 |
3.5b |
121.7 |
-5.1b |
-8.6b |
|
Diastolic Blood Pressure (mmHg)h |
81.7 |
-2.9 |
78.3 |
2.1b |
79.3 |
-3.2b |
-5.3b |
|
Pulse Rate (beats per minute)h |
73.0 |
-1.6 |
70.7 |
0.9f |
72.2 |
2.7f |
1.8f |
|
HbA1c (%)h |
5.5 |
-0.1 |
5.4 |
0.0b |
5.3 |
-0.4b |
-0.4b |
|
Total Cholesterol (mg/dL)g,h |
190.2 |
-8.6 |
181.6 |
4.3 |
181.7 |
-2.4 |
-6.4b |
|
LDL Cholesterol (mg/dL)g,h |
111.6 |
-3.5 |
107.5 |
4.4 |
108.0 |
-5.6 |
-9.6b |
|
HDL Cholesterol (mg/dL)g,h |
48.4 |
-1.2 |
47.8 |
5.4 |
46.9 |
15.2 |
9.3b |
|
Non-HDL Cholesterol (mg/dL)g,h |
139.2 |
-7.4 |
131.5 |
4.4 |
132.4 |
-8.8 |
-12.6b |
|
Triglycerides (mg/dL)g,h |
123.1 |
-19.8 |
108.8 |
2.1 |
111.7 |
-23.5 |
-25.1b |
Weight Reduction Following Randomized Withdrawal in Adults with Obesity or Overweight (Study 4)
Overview of Study 4
Study 4 (NCT04660643) was an 88-week randomized withdrawal trial in which all patients received open-label ZEPBOUND during a 36-week lead-in period, followed by randomization to either continue ZEPBOUND or switch to placebo for 52 weeks. The trial enrolled 783 adult patients (aged 18 years and older) with obesity (BMI ≥30 kg/m2), or with overweight (BMI 27 to <30 kg/m2) and at least one weight-related comorbid condition, such as dyslipidemia, hypertension, obstructive sleep apnea, or cardiovascular disease; patients with type 2 diabetes mellitus were excluded. All patients received a standard lifestyle intervention which included instruction on a reduced-calorie diet (approximately 500 kcal/day deficit) and increased physical activity counseling (recommended minimum of 150 min/week) that began with the first dose of ZEPBOUND, during the lead-in period, and continued throughout the trial. During the 36-week open-label ZEPBOUND lead-in period, ZEPBOUND dosages were escalated over a period of up to 20 weeks to an MTD of 10 mg or 15 mg subcutaneous once weekly. After the lead-in period, patients were randomized at Week 36 to continue ZEPBOUND or switch to placebo for 52 weeks.
Of the 783 patients who started ZEPBOUND at Week 0, 14.4% discontinued treatment before randomization at Week 36, and adverse events were the most common reason for discontinuation (6.8%). At Week 36, a total of 670 patients were randomized in a 1:1 ratio to ZEPBOUND MTD or placebo for 52 weeks. For the 670 randomized patients, at study entry (Week 0) mean body weight was 107.3 kg and mean BMI was 38.4 kg/m2, and at randomization (Week 36, after the open-label ZEPBOUND lead-in period) mean body weight was 85.2 kg and mean BMI was 30.5 kg/m2. Among the randomized patients, the mean age was 49 years (range 19-81 years), 71% were female, 80% were White, 11% were Black or African American, and 7% were Asian. A total of 44% were Hispanic or Latino ethnicity. Baseline characteristics for the 670 randomized patients included 35% with hypertension, 32% with dyslipidemia, 12% with obstructive sleep apnea, and 6% with cardiovascular disease.
Results for Study 4
At the end of the 36-week open-label ZEPBOUND lead-in period, of the 670 randomized patients, 93% were on ZEPBOUND MTD of 15 mg weekly and 7% were on MTD of 10 mg weekly. After open-label ZEPBOUND treatment, randomized patients (n=670) had an average body weight loss of 20.9% (Week 0 to Week 36). The time course of weight reduction from Week 0 through Week 88 is depicted in Figure 6.
Figure 6: Change in Body Weight (%) After 36-Week Open-Label Treatment Followed by Randomized Withdrawal (Study 4) in Patients with Obesity or Overweight
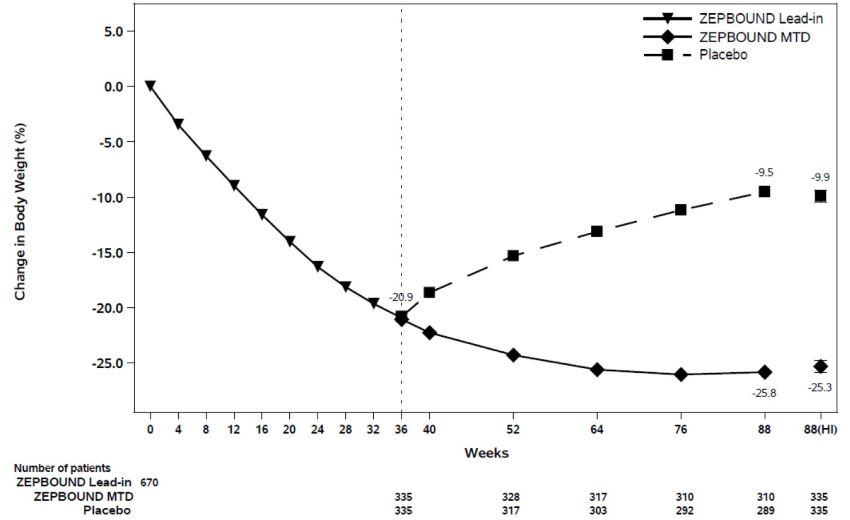
Note: Displayed results are from the randomized population. (1) Displayed results are observed mean value from Week 0 to Week 88 and (2) least squares mean ± standard error at Week 88 hybrid imputation (HI). Change from Week 0 was not a primary endpoint in Study 4.
The proportions of patients who discontinued study drug after randomization at Week 36 were 10.4% for the ZEPBOUND-treated group and 17.9% for the placebo- treated group.
For Study 4, the primary efficacy parameter was mean percent change in body weight from randomization (Week 36) to Week 88. After weight loss with ZEPBOUND treatment during the open-label lead-in period (Week 0 to Week 36), continued treatment with ZEPBOUND from randomization (Week 36) to Week 88 resulted in a statistically significant reduction in body weight compared with placebo (see Table 6).
Table 6: Changes in Body Weight After 36-Week Open-Label Treatment Followed by Randomized Withdrawal (Study 4) in Patients with Obesity or Overweight|
Abbreviations: ANCOVA = analysis of covariance; CI = confidence interval; MTD = maximum tolerated dose; N = number of patients randomly assigned to study drug. | ||
|
a The intent-to-treat population included all randomly assigned patients and did not include 113 patients who were enrolled but not randomized. At Week 88, body weight was missing for 13.7% and 7.5% of patients randomly assigned to placebo and ZEPBOUND MTD (10 or 15 mg), respectively. The missing values were imputed by a hybrid approach using retrieved dropouts from the same treatment group (if missing not due to COVID-19) or using all non-missing data assuming missing at random (for missing solely due to COVID-19). | ||
|
b Least-squares mean from ANCOVA adjusted for baseline value and other stratification factors. | ||
|
c p-value<0.001 (unadjusted 2-sided) for superiority, controlled for type I error rate. | ||
|
Study 4 | ||
|
Body weight | ||
|
Mean at Week 0 (kg) |
107.3 | |
|
Intention-to-Treat (ITT) Populationa |
Placebo |
ZEPBOUND |
|
Body Weight | ||
|
Mean at Week 36 (kg) |
85.8 |
84.6 |
|
% change from Week 36 at Week 88b |
14.0 |
-5.5 |
|
% difference from placebo at Week 88 |
-19.4 |
Changes in waist circumference and cardiometabolic parameters in Study 4 are shown in Table 7.
Table 7: Mean Changes in Anthropometry and Cardiometabolic Parameters After 36-Week Open-Label Treatment Followed by Randomized Withdrawal (Study 4) in Patients with Obesity or Overweight|
Abbreviations: ANCOVA = analysis of covariance; CI = confidence interval; N = number of patients randomly assigned to study drug. | |||||||
|
a The intent-to-treat population included all randomly assigned patients. The missing values were imputed by a hybrid approach using retrieved dropouts from the same treatment group (if missing not due to COVID-19) or using all non- missing data assuming missing at random (for missing solely due to COVID-19). | |||||||
|
b Least-squares mean from ANCOVA adjusted for baseline value and other stratification factors. | |||||||
|
c Analyzed using log-transformed data. | |||||||
|
d p-value<0.001 (unadjusted 2-sided) for superiority, controlled for type I error rate. | |||||||
|
e Not controlled for type I error rate. | |||||||
|
f Least-squares mean from mixed model for repeated measures adjusted for baseline value and other stratification factors. | |||||||
|
g Baseline and randomization values are the geometric mean. | |||||||
|
h Observed means are shown for change from Week 0 to Week 36. Least-square means are shown for change from Week 36 to Week 88. | |||||||
|
Intention-to-Treat (ITT) Populationa |
All Randomized Patients**** |
Placebo**** |
ZEPBOUND MTD (10mg or 15mg)**** | ||||
|
Baseline (Week 0) |
Change from Week 0 to Week 36 |
Randomization (Week 36) |
Change from Week 36 to Week 88 |
Randomization (Week 36) |
Change from Week 36 to Week 88 |
Difference from placebo, Week 36 to Week 88**** | |
|
Waist circumference (cm)h |
115.2 |
-17.8 |
98.2 |
7.8b |
96.8 |
-4.3b |
-12.1b |
|
Systolic Blood Pressure (mmHg)h |
126.1 |
-11.2 |
114.8 |
8.2b |
115.0 |
2.0b |
-6.2b |
|
Diastolic Blood Pressure (mmHg)h |
80.9 |
-5.1 |
76.2 |
3.2b |
75.4 |
-0.7b |
-3.8b |
|
Pulse Rate (beats per minute)h |
72.5 |
5.0 |
77.8 |
-5.2f |
77.1 |
-2.1f |
3.1f |
|
HbA1c (%)h |
5.5 |
-0.5 |
5.0 |
0.3b |
5.1 |
-0.0b |
-0.3b |
|
Total Cholesterol (mg/dL)g,h |
188.3 |
-12.4 |
176.1 |
8.0 |
175.9 |
2.7 |
-4.9b |
|
LDL Cholesterol (mg/dL)g,h |
108.6 |
-1.9 |
107.6 |
3.2 |
105.9 |
-3.5 |
-6.5b |
|
HDL Cholesterol (mg/dL)g,h |
49.9 |
-2.7 |
47.3 |
14.8 |
47.7 |
18.7 |
3.4b |
|
Non-HDL Cholesterol (mg/dL)g,h |
135.8 |
-9.8 |
126.3 |
5.1 |
126.0 |
-3.4 |
-8.1b |
|
Triglycerides (mg/dL)g,h |
121.4 |
-40.4 |
85.5 |
13.5 |
90.9 |
-4.8 |
-16.1b |
14.2 Obstructive Sleep Apnea Studies in Adults with Obesity
Overview of Study 5 and Study 6
The efficacy of ZEPBOUND for moderate to severe obstructive sleep apnea (OSA) (apnea-hypopnea index [AHI] ≥15) in patients with obesity (BMI ≥30 kg/m2) was evaluated in a master protocol clinical trial (NCT05412004) that included two randomized, double-blind, placebo-controlled trials (Study 5 and Study 6) of 52 weeks duration. The two trials enrolled a total of 469 adult patients.
In Studies 5 and 6, patients were randomized in a 1:1 ratio to receive ZEPBOUND or placebo for 52 weeks. ZEPBOUND dosages were escalated over a period of up to 20 weeks to maximum tolerated dosage (MTD) of 10 mg or 15 mg subcutaneous once weekly [see Dosage and Administration (2.1, 2.2)]. Patients with type 2 diabetes mellitus were excluded and all patients received instruction on a reduced-calorie diet and increased physical activity counseling throughout the study.
Study 5 enrolled 234 adult patients with moderate to severe OSA and obesity who were unable or unwilling to use Positive Airway Pressure (PAP) therapy. Patients had a mean age of 48 years (range: 20 to 76 years), 67% were male, 66% were White, 20% were Asian, 8% were American Indian/Alaska Native, and 6% were Black or African American. A total of 42% were Hispanic or Latino ethnicity.
Study 6 enrolled 235 adult patients with moderate to severe OSA and obesity who were on PAP therapy. Patients had a mean age of 52 years (range: 26 to 79 years), 72% were male, 73% were White, 14% were Asian, 8% were American Indian/Alaska Native, and 5% were Black or African American. A total of 32% were Hispanic or Latino ethnicity.
Table 8 describes the baseline disease characteristics of patients in Studies 5 and 6.
Table 8: Baseline Disease Characteristics of Patients with OSA and Obesity in Study 5 and Study 6|
Abbreviations: AHI = Apnea-Hypopnea Index; BMI = body-mass index; ESS = Epworth Sleepiness Score; OSA = obstructive sleep apnea; SD = standard deviation. | ||
|
a Moderate OSA was defined as an AHI ≥15 – 30 events/hour on polysomnogram at baseline. | ||
|
b Severe OSA was defined as an AHI ≥30 events/hour on polysomnogram at baseline. | ||
|
Study 5 (N=234) |
Study 6 (N=235) | |
|
Baseline AHI (events/hour), mean (SD) |
51.5 (31) |
49.5 (26.7) |
|
Moderate OSA, %a |
35.2 |
30.9 |
|
Severe OSA, %b |
63.1 |
68.2 |
|
ESS Total, mean (SD) |
10.5 (5.2) |
10 (4.6) |
|
Total Hypoxic Burden (% min/hour), mean (SD) |
208.4 (189.1) |
193 (174.6) |
|
BMI (kg/m2), mean (SD) |
39.1 (7) |
38.7 (6) |
|
Pre-diabetes, % |
65 |
56.6 |
|
Hypertension, % |
75.6 |
77.4 |
|
Cardiac disorders, % |
10.3 |
11.1 |
|
Dyslipidemia, % |
80.8 |
83.8 |
Results for Study 5 and Study 6
The primary endpoint for Studies 5 and 6 was the change from baseline in the apnea-hypopnea index (AHI) at Week 52. Patients in Study 5 were unable or unwilling to use PAP therapy, and patients in Study 6 were on PAP therapy and instructed to suspend PAP for 7 days prior to assessment of the primary endpoint. The clinical studies for OSA did not evaluate the timing or appropriateness of PAP discontinuation in patients who were previously compliant with PAP therapy.
In Studies 5 and 6, treatment with ZEPBOUND for 52 weeks resulted in a statistically significant reduction in AHI compared with placebo, and greater proportions of patients treated with ZEPBOUND achieved remission or mild non- symptomatic OSA compared to placebo. Table 9 provides the efficacy results for Studies 5 and 6. A reduction in AHI was observed with ZEPBOUND irrespective of age, sex, ethnicity, baseline BMI, or baseline OSA severity. In both Studies 5 and 6, patients treated with ZEPBOUND achieved a greater reduction in systolic blood pressure and high-sensitivity C-reactive protein levels compared to placebo.
Table 9: Changes in Apnea-Hypopnea Index (AHI), Hypoxic Burden, and Body Weight at Week 52 in Study 5 and Study 6|
Abbreviations: AHI = Apnea-Hypopnea Index; ANCOVA = analysis of covariance; CI = confidence interval; ESS = Epworth Sleepiness Scale; h = hour; MTD = maximum tolerated dose; N = number of participants randomly assigned and received at least 1 dose of study drug. | ||||
|
a Analyses were based on the modified intent-to-treat population which was defined as randomly assigned participants who were exposed to at least 1 dose of study intervention; two participants in Study 6 were randomized but did not receive study drug. | ||||
|
b Least-squares mean from ANCOVA adjusted for baseline values and stratification factors, with multiple imputation for missing data at Week 52. | ||||
|
c Analyzed using log transformed data. | ||||
|
d Calculated by combining proportion of participants achieving target in imputed datasets. | ||||
|
e p-value <0.001 (unadjusted 2-sided) for superiority, controlled for multiplicity. | ||||
|
f Baseline value is the geometric mean. | ||||
|
Modified Intent-to-Treat (mITT) Populationa |
Study 5 |
Study 6 | ||
|
Placebo |
ZEPBOUND MTD (10 mg or 15 mg) |
Placebo |
ZEPBOUND MTD (10 mg or 15 mg) | |
|
AHI (events/hr) | ||||
|
Baseline mean |
50.1 |
52.9 |
53.1 |
46.1 |
|
Change from baselineb |
-5.3 |
-25.3 |
-5.5 |
-29.3 |
|
Difference from placebob (95% CI) |
-20 (-25.8, -14.2)e |
-23.8 (-29.6, -17.9)e | ||
|
% change in AHI | ||||
|
% change from baselineb |
-3 |
-50.7 |
-2.5 |
-58.7 |
|
% difference from placebob (95% CI) |
-47.7 (-65.8, -29.6)e |
-56.2 (-73.7, -38.7)e | ||
|
% of patients with ≥50% reduction in AHId |
19 |
61.2 |
23.3 |
72.4 |
|
% difference from placebo (95% CI) |
42.8 (30.8, 54.8)e |
48.6 (36.6, 60.7)e | ||
|
Remission or mild non-symptomatic OSA | ||||
|
% of Patients with AHI <5 or AHI 5-14 and ESS≤10d |
15.9 |
42.2 |
14.3 |
50.2 |
|
% difference from placebo (95% CI) |
28.7 (18.3, 39.2)e |
33.2 (22.1, 44.3)e | ||
|
Sleep apnea-specific hypoxic burden (% min/h) | ||||
|
Baseline meanf |
137.8 |
153.6 |
142.1 |
132.2 |
|
Change from baselineb |
-25.1 |
-95.2 |
-41.7 |
-103 |
|
Difference from placebob (95% CI) |
-70.1 (-90.9, -49.3)c,e |
-61.3 (-84.7, -37.9)c,e | ||
|
Body weight (kg) | ||||
|
Baseline mean |
112.8 |
116.7 |
115.1 |
115.8 |
|
% change from baselineb |
-1.6 |
-17.7 |
-2.3 |
-19.6 |
|
% difference from placebob (95% CI) |
-16.1 (-18, -14.2)e |
-17.3 (-19.3, -15.3)e |
The time course of change in AHI with ZEPBOUND and placebo from baseline through Week 52 are shown in Figure 7 for Study 5. Similar results were demonstrated for Study 6.
Figure 7: Change from Baseline in Apnea-Hypopnea Index (AHI) Through Week 52 (Study 5)
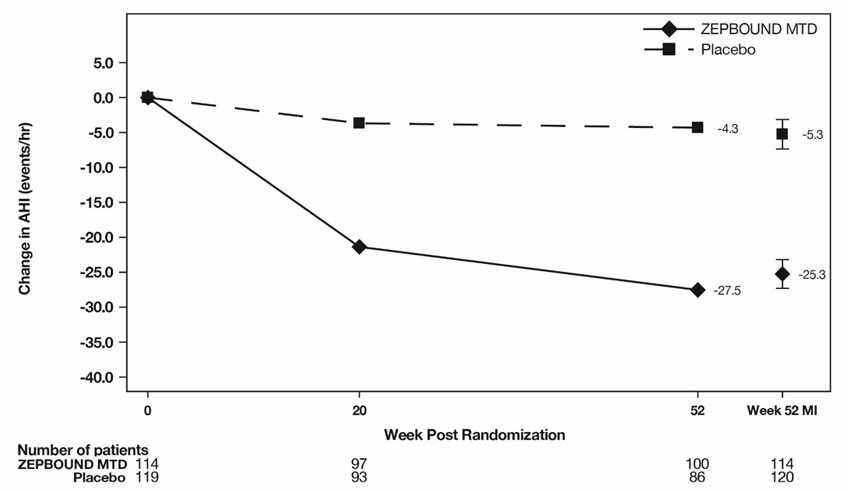
Abbreviations: AHI = Apnea-Hypopnea Index; ANCOVA = analysis of covariance; MI = multiple imputation; MTD = maximum tolerated dose.
Note: Displayed results are from modified Intent-to-Treat Population. (1) Observed mean value from Week 0 through Week 52, and (2) least squares mean ± standard error at Week 52 from ANCOVA adjusted for baseline values and stratification factors, with multiple imputation of missing data.
Sleep-Related Impairment
In OSA clinical studies (Study 5 and Study 6), ZEPBOUND-treated patients showed improvement in sleep-related impairment compared to those who received placebo. Sleep-related impairment was assessed using the Patient-Reported Outcomes Measurement Information System® (PROMIS) Short Form Sleep-Related Impairment 8a.
DESCRIPTION SECTION
11 DESCRIPTION
ZEPBOUND (tirzepatide) injection, for subcutaneous use, contains tirzepatide, a GIP receptor and GLP-1 receptor agonist. Tirzepatide is based on the GIP sequence and contains aminoisobutyric acid (Aib) in positions 2 and 13, a C-terminal amide, and Lys residue at position 20 that is attached to 1,20-eicosanedioic acid via a linker. The molecular weight is 4813.53 Da and the empirical formula is C225H348N48O68.
Structural formula:
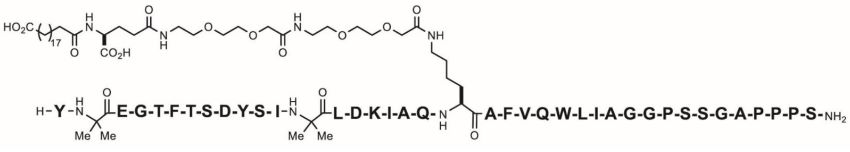
ZEPBOUND is a clear, colorless to slightly yellow, sterile solution for subcutaneous use. Each single-dose pen or single-dose vial contains preservative-free 0.5 mL solution of 2.5 mg, 5 mg, 7.5 mg, 10 mg, 12.5 mg, or 15 mg of tirzepatide and the following excipients: sodium chloride (4.1 mg), sodium phosphate dibasic heptahydrate (0.7 mg), and water for injection. Hydrochloric acid solution and/or sodium hydroxide solution may have been added to adjust the pH. ZEPBOUND has a pH of 6.5 – 7.5.
INSTRUCTIONS FOR USE SECTION
SINGLE-DOSE VIAL INSTRUCTIONS FOR USE
|
INSTRUCTIONS FOR USE 2.5 mg/0.5 mL single-dose vial |
Important information you need to know before injecting ZEPBOUND
Read this Instructions for Use before you start taking ZEPBOUND and each time you get a new vial. There may be new information. This information does not take the place of talking to your healthcare provider about your medical condition or your treatment.
Do not share your needles or syringes with other people. You may give other people a serious infection or get a serious infection from them.
Talk to your healthcare provider about how to inject ZEPBOUND the right way.
- ZEPBOUND is a single-dose vial.
- ZEPBOUND is used 1 time each week.
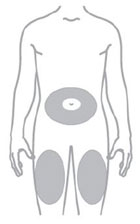
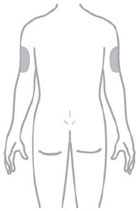
- Inject under the skin (subcutaneously) only.
- You or another person may inject into your stomach (abdomen) or thigh.
- Another person can inject into the back of your upper arm.
Gather supplies needed to give your injection
- 1 single-dose ZEPBOUND vial
- 1 syringe and 1 needle, supplied separately (for example, use a 1 mL syringe and needle as recommended by your healthcare provider)
- 1 alcohol swab
- gauze
- 1 sharps container for throwing away used needles and syringes.See “Disposing of used needles and syringes” at the end of these instructions.
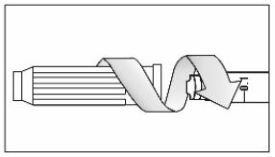
|
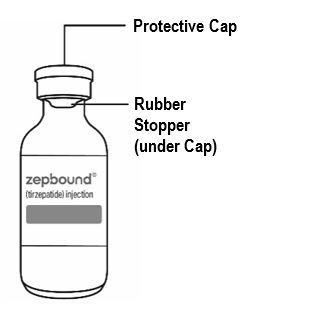
Guide to parts Vial |
Needle and Syringe (not included) |
|
|
|
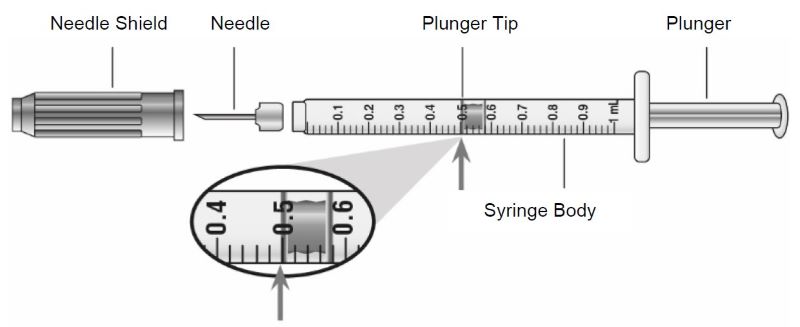
Note: The needle and syringe are not included. The needle and syringe recommended by your healthcare provider may look different than the needle and syringe in this Instructions for Use.
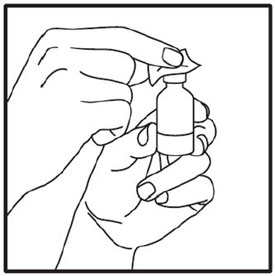
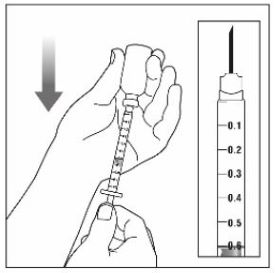
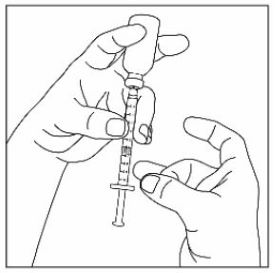
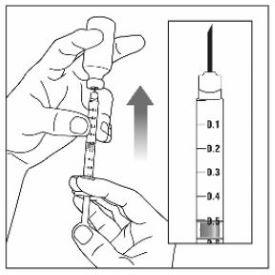
Preparing to inject ZEPBOUND
Remove the vial from the refrigerator.
Check the vial label to make sure you have the right medicine and dose, and that it has not expired.
Make sure the medicine:
|
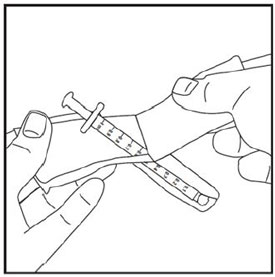
|
Always use a new syringe and needle for each injection to prevent infections and blocked needles. Do not reuse or share your syringes or needles with other people. You may give other people a serious infection or get a serious infection from them.
Wash your hands with soap and water.
|
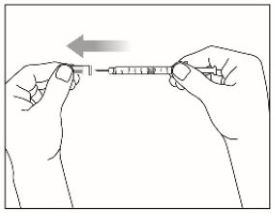
Step 1: |
|
|
Step 2: |
|
|
Step 3: |
|
|
Step 4: |
|
|
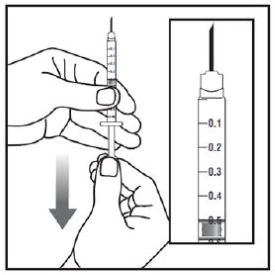
Step 5: |
|
|
Step 6: |
|
|
Step 7: |
|
|
Step 8: |
|
|
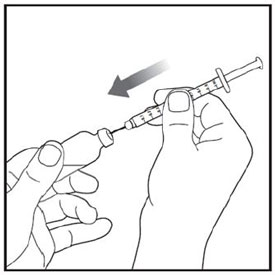
Step 9: |
|
|
Step 10: |
|
|
Step 11: |
|
|
Step 12: |
|
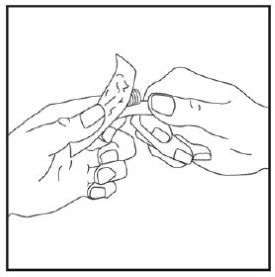
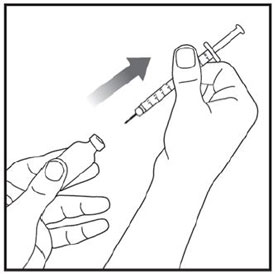
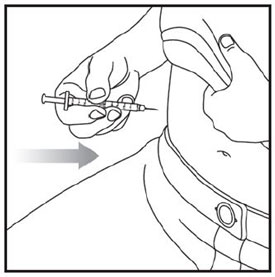
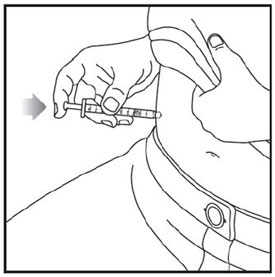
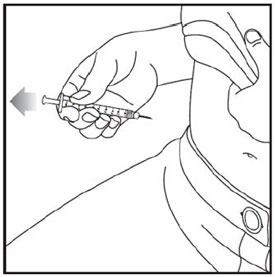
Injecting ZEPBOUND
- Inject exactly as your healthcare provider has shown you. Your healthcare provider should tell you if you should pinch the skin before injecting. *Change (rotate) your injection site within the area you choose for each dose to reduce your risk of getting lipodystrophy (pits in skin or thickened skin) and localized cutaneous amyloidosis (skin with lumps) at the injection sites. *Do not inject where the skin has pits, is thickened, or has lumps. *Do not inject where the skin is tender, bruised, scaly or hard, or into scars or damaged skin. *Do not mix ZEPBOUND with any other medicine. *Do not inject ZEPBOUND in the same injection site used for other medicines.
|
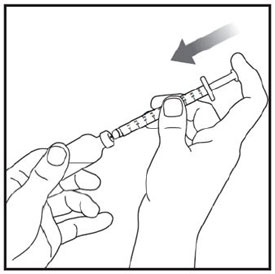
Step 13: |
|
|
Step 14: |
|
|
Step 15: |
|
|
Step 16:
|
|
Disposing of used needles and syringes
- Put your used needle and syringe in an FDA-cleared sharps disposal container right away after use.Do not throw away (dispose of) loose needles and syringes in your household trash.
- If you do not have an FDA-cleared sharps disposal container, you may use a household container that is:
-
made of a heavy-duty plastic,
-
can be closed with a tight-fitting, puncture-resistant lid, without sharps being able to come out,
-
upright and stable during use,
-
leak-resistant, and
-
properly labeled to warn of hazardous waste inside the container.
- When your sharps disposal container is almost full, you will need to follow your community guidelines for the right way to dispose of your sharps disposal container. There may be state or local laws about how you should throw away used needles and syringes. For more information about safe sharps disposal, and for specific information about sharps disposal in the state that you live in, go to the FDA’s website at:
http://www.fda.gov/safesharpsdisposal.
*Do not dispose of your used sharps disposal container in your household trash unless your community guidelines permit this.Do not recycle your used sharps disposal container.
Storing ZEPBOUND
- Store all unopened vials in the refrigerator at 36°F to 46°F (2°C to 8°C).
- You may store the unopened vial at room temperature up to 86°F (30°C) for up to 21 days. *Do not freeze.Do not use if ZEPBOUND has been frozen.
- Store the vial in the original carton to protect from light.
- Throw away all opened vials after use, even if there is medicine left in the vial.
Keep ZEPBOUND vials, syringes, needles, and all medicines out of the reach of children.
If you have any questions or problems with your ZEPBOUND, contact Lilly at 1-800-Lilly-Rx (1-800-545-5979) or call your healthcare provider for help.
Marketed by:
Lilly USA, LLC
Indianapolis, IN 46285, USA
ZEPBOUND is a registered trademark of Eli Lilly and Company.
Copyright © 2024, Eli Lilly and Company. All rights reserved.
ZEP-0001-VL-IFU-20240328
This Instructions for Use has been approved by the U.S. Food and Drug Administration.
Issued: March 2024